Two latest polls need to be taken with a grain of salt
The political news world is abuzz discussing two polls that favor one candidate or the other due to differing flaws in each.
The first poll is one The Washington Post can’t stop talking about – probably because it paid for it. The Washington Post/Survey Monkey poll shows Hillary neck-and-neck in .. Texas??
Trump is struggling in places Republicans have won consistently and that he must hold to have any hope of winning. These states include Arizona and Georgia, as well as Texas — the biggest surprise in the 50-state results. The Texas results, which are based on a sample of more than 5,000 people, show a dead heat, with Clinton ahead by one percentage point.
The poll ran from August 9th to September 1st and polled 74,000 people across all 50 states. Instead of a random phone poll, this survey was performed by offering the poll to SurveyMonkey’s subscriber-base of people who, obviously, really like to take polls.
Respondents were chosen after having answered an unrelated poll on the survey site. Once selected, they were given an invitation to take the 50-state survey. Only responses from registered voters were tabulated and the sample was weighted to the last census.
This methodology is non-random and has little chance of correctly representing likely voters.
The survey was also run over an extremely long timeline in relation to standard polling. The poll ran for more than 3 weeks and included numerous events that could have skewed respondent sentiment.
All-in-all, I wouldn’t put much faith in Texas or Georgia being as close as this survey would indicate.
The second poll with an interesting outcome is the CNN/ORC poll that shows Trump retaking the lead in a nationwide survey.
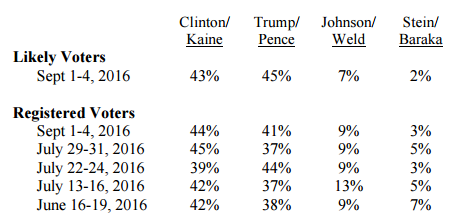
Trump tops Clinton 45% to 43% in the new survey, with Libertarian Gary Johnson standing at 7% among likely voters in this poll and the Green Party’s Jill Stein at just 2%.
Among registered voters in the poll, Clinton edges out Trump by three points:
Whenever I see a reversal in a poll, the first thing I look at is the sample make up and this one explains everything.
A total of 1,001 adults were interviewed by telephone nationwide by live interviewers calling both landline and cell phones. Among the entire sample, 28% described themselves as Democrats, 32% described themselves as Republicans, and 40% described themselves as independents or members of another party.
A +4 Republican sample? Trump would have to pull-off an historic get-out-the-vote effort to manage a dead-even Republican/Democrat turn out for the election, much less a four point advantage.
The last time CNN ran this poll, they included a +4 Democrat advantage – the more likely turnout for November, so why the eight point shift?
I’m not a huge fan of nation-wide polls because we don’t vote for President that way. The state results are more indicative of a candidate’s position in the race.
Both of these polls raise more questions than they answer about the 2016 Presidential race and just go to show that statistics can be made to prove just about anything.


