Government Report Shows American Airlines Most Likely Carrier to Leave You Waiting on the Tarmac or to Cancel Your Flight
WASHINGTON – The U.S. Department of Transportation (DOT) today released its August 2019 Air Travel Consumer Report (ATCR) on air carrier data compiled for the month of June 2019 which gives low marks to American Airlines for long delays after passengers have already boarded and for flight cancellations.
Tarmac Delays
In June 2019, airlines reported 49 tarmac delays of more than three hours on domestic flights, compared to 44 such tarmac delays reported in May 2019 and 25 tarmac delays reported in June 2018. In June 2019, airlines reported two tarmac delays of more than four hours on international flights, compared to seven tarmac delays reported in May 2019 and two tarmac delays reported in June 2018. Extended tarmac delays are investigated by the Department.
Domestic Flights with Longest Tarmac Delays Exceeding Three Hours (ATCR Table 8)
- American Airlines flight 2357 from Salt Lake City International Airport (SLC) to Dallas Fort Worth International Airport (DFW), 6/9/19 – delayed 3 hours and 55 minutes on the tarmac at DFW.
- American Airlines flight 2308 from Sacramento International Airport (SMF) to DFW, 6/9/19 – delayed 3 hours and 47 minutes on the tarmac at DFW.
- American Airlines flight 2550 from Miami International Airport (MIA) to DFW 6/9/19 – delayed 3 hours and 44 minutes on the tarmac at DFW.
June Cancellations
In June 2019, reporting marketing carriers canceled 2.1% of their scheduled domestic flights, a higher rate than both the rate of 2.0% in May 2019 and 1.8% in June 2018.
Highest Reporting Marketing Carrier Rates of Canceled Flights (ATCR Table 6)
- American Airlines Network – 4.0%
- Frontier Airlines – 2.7%
- United Airlines Network – 2.2%
Lowest Reporting Marketing Carrier Rates of Canceled Flights (ATCR Table 6)
- Hawaiian Airlines Network – 0.4%
- Allegiant Air – 0.5%
- JetBlue Airways – 0.5%
June On-Time Performance
In June 2019, reporting carriers posted an on-time arrival rate of 73.3%, down from both the 77.9% on-time rate in May 2019 and from 76.4% in June 2018.
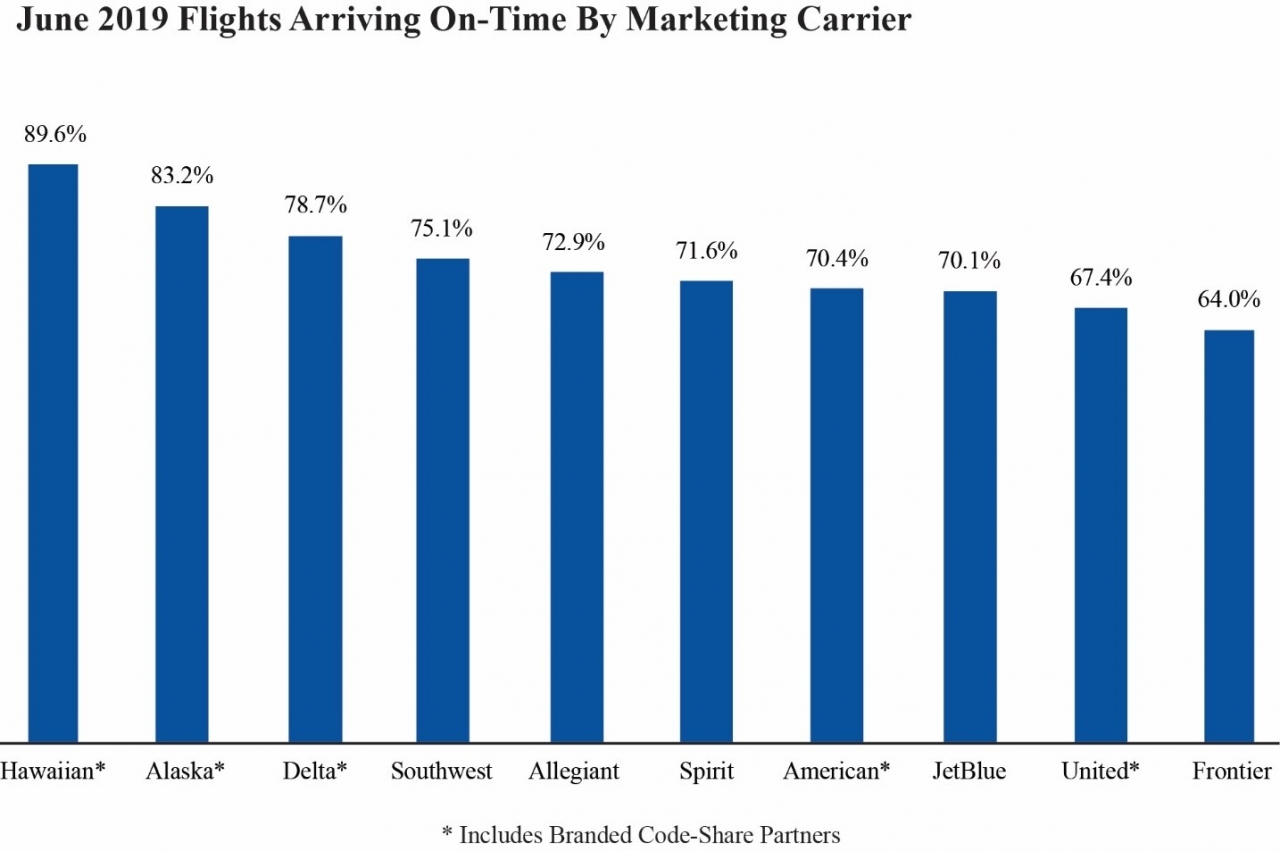
Highest Reporting Marketing Carrier On-Time Arrival Rates (ATCR Table 1)
- Hawaiian Airlines Network – 89.6%
- Alaska Airlines Network – 83.2%
- Delta Air Lines Network – 78.7%
Lowest Reporting Marketing Carrier On-Time Arrival Rates (ATCR Table 1)
- Frontier Airlines – 64.0%
- United Airlines Network – 67.4%
- JetBlue Airways – 70.1%
Mishandled Baggage
In June 2019, the reporting marketing carriers posted a mishandled baggage rate of 7.07 mishandled bags per 1,000 checked bags, a higher rate than May 2019’s rate of 6.26 per 1,000 checked bags. For the first six months of the year, the carriers posted a mishandled baggage rate of 6.01 per 1,000 checked bags.
See the August 2019 Air Travel Consumer Report for mishandled wheelchair and scooter numbers by airline.
Incidents Involving Animals
In June 2019, U.S. airlines reported one incident involving the death, injury, or loss of an animal while traveling by air, down from the four reports filed in June 2018 and down from the four reports filed in May 2019. June’s incidents involved the death of one animal.
Complaints About Airline Service
In June 2019, DOT received 1,586 complaints about airline service from consumers, up 7% from the total of 1,477 filed in June 2018 and up 21% from the 1,289 received in May 2019.
For the first six months of 2019, DOT received 7,161 complaints about airline service from consumers, down 4% from 7,439 received in the first six months of 2018.
Content created by Conservative Daily News is available for re-publication without charge under the Creative Commons license. Visit our syndication page for details and requirements.