New-Vehicle Prices Flirt with Record High in May
- New-vehicle buyers are in an “over sticker” market, paying well above MSRP every month this year
- With low inventory and high demand, incentives dropped to a record low in May, averaging only 2.5% of the average transaction price
- Strong luxury share – at 17.3% of sales – helps push industry average price higher. Luxury share in May 2021 was 15.9% and even lower pre-pandemic, at 13.1% in May 2019
New-vehicle average transaction prices (ATPs) increased to $47,148 in May 2022, according to new data released by Kelley Blue Book, a Cox Automotive company. Prices rose 1% ($472) month over month and remain elevated compared to one year ago, up 13.5% ($5,613) from May 2021. The average price paid for a new vehicle in the U.S. last month was the second-highest on record, behind only December 2021, when ATPs reached $47,202.
New-vehicle inventory days’ supply stayed in the mid-30s in May – holding steady since mid-January – while customer demand remained stable. These conditions enabled most dealers to continue selling inventory at or above the manufacturer’s suggested retail price (MSRP). The average price paid for a new vehicle has been “over sticker” throughout 2022. In May, new vehicles from Honda, Land Rover and Mercedes-Benz were transacting on average between 6.1% and 9.3% over MSRP. On the other side of the spectrum, Buick and Lincoln were selling at nearly 1% below MSRP.
New-vehicle average transaction prices increased to $47,148 in May 2022, according to data released by Kelley Blue Book
“Prices for both new and used vehicles are showing signs of stabilizing, and price growth will likely decline over the course of the summer as the anniversary of the ‘big squeeze’ in inventory passes,” said Rebecca Rydzewski, research manager of economic and industry insights for Cox Automotive. “However, no one should expect price drops, as tight supplies in the new market will hold prices at an elevated level into 2023.”
The average price paid for a new non-luxury vehicle last month was $43,338, up $709 from April. Car shoppers in the non-luxury segment paid on average $1,030 above sticker price. Consumers have paid more than MSRP in each month of 2022, whereas one year ago, non-luxury vehicles were selling for more than $400 under MSRP.
In May 2022, the average luxury buyer paid $65,379 for a new vehicle, down $511 month over month but still $1,071 above sticker price. For comparison, luxury vehicles were selling for nearly $1,300 under MSRP one year ago. Luxury vehicle share remains historically high, but decreased to 17.3% of total sales in May, down slightly from 17.4% in April. For comparison, luxury share in May 2021 was 15.9% and, pre-pandemic, luxury share in May 2019 was 13.1% of the total market.
The average price paid for a new electric vehicle (EV) dropped again in May compared to April, as more lower-priced models enter the market and offset the many luxury EVs already available. The Chevrolet Bolt, with average transaction prices below $40,000, is available on dealer lots after an extensive recall, and the new Kia EV6 is selling well. Even Tesla had slightly lower ATPs month over month in May. Still, the average price for a new electric vehicle – over $64,000 according to Kelley Blue Book estimates – is well above the industry average and more aligned with luxury prices than mainstream prices.
New-vehicle average transaction price changes month over month by segment saw all segments increasing except cars, mirroring April. With an ATP of $56,216, trucks saw the largest increase of $888. With an ATP of $48,671, vans saw an increase of $726 in May, while SUVs increased by $526 to an ATP of $46,073. Cars had an average transaction price of $41,902 in May, a $179 decrease month over month. Meanwhile, vans still had the lowest incentives (expressed as a percent of ATP) at 1.4%, and trucks had the highest at 2.9%. Incentives dropped to a record low level in May, averaging only 2.5% of the average transaction price.
| Manufacturer | May 2022 Transaction Price (Avg)* | April 2022 Transaction Price (Avg)* | May 2021 Transaction Price (Avg)* | Month- Over- Month Percent Change | Year- Over- Year Percent Change |
| BMW | $67,563 | $67,323 | $58,383 | 0.4% | 15.7% |
| Daimler | $76,161 | $76,340 | $65,872 | -0.2% | 15.6% |
| Ford Motor Company | $52,211 | $49,634 | $45,826 | 5.2% | 13.9% |
| Geely Auto Group | $61,820 | $62,325 | $52,179 | -0.8% | 18.5% |
| General Motors | $50,629 | $49,830 | $48,563 | 1.6% | 4.3% |
| Honda Motor Company | $38,141 | $37,307 | $32,610 | 2.2% | 17.0% |
| Hyundai Motor Group | $35,967 | $36,260 | $31,180 | -0.8% | 15.4% |
| Mazda Motor Corporation | $30,767 | $31,220 | $30,917 | -1.5% | -0.5% |
| Renault-Nissan-Mitsubishi Alliance | $36,245 | $35,509 | $31,982 | 2.1% | 13.3% |
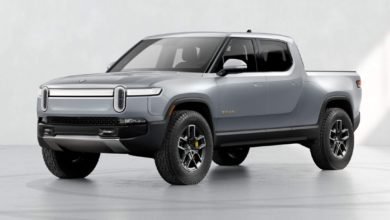
| Rivian | $72,973 | $72,687 | – | 0.4% | – |
| Stellantis | $53,929 | $54,214 | $48,104 | -0.5% | 12.1% |
| Subaru Corporation | $33,859 | $34,660 | $33,521 | -2.3% | 1.0% |
| Tata Motors | $89,203 | $89,076 | $79,856 | 0.1% | 11.7% |
| Tesla Motors | $64,989 | $65,369 | $57,522 | -0.6% | 13.0% |
| Toyota Motor Corporation | $39,174 | $39,785 | $37,397 | -1.5% | 4.8% |
| Volkswagen Group | $51,975 | $55,044 | $47,612 | -5.6% | 9.2% |
| Industry | $47,148 | $46,676 | $41,534 | 1.0% | 13.5% |
| *Kelley Blue Book average transaction prices do not include applied consumer incentives |
| Make | May 2022 Transaction Price (Avg)* | April 2022 Transaction Price (Avg)* | May 2021 Transaction Price (Avg)* | Month- Over- Month Percent Change | Year- Over- Year Percent Change |
| Acura | $54,775 | $53,335 | $45,157 | 2.7% | 21.3% |
| Alfa Romeo | $53,224 | $53,545 | $46,971 | -0.6% | 13.3% |
| Audi | $62,133 | $64,436 | $59,536 | -3.6% | 4.4% |
| BMW | $69,270 | $68,665 | $60,716 | 0.9% | 14.1% |
| Buick | $38,371 | $38,968 | $35,083 | -1.5% | 9.4% |
| Cadillac | $71,479 | $69,304 | $68,284 | 3.1% | 4.7% |
| Chevrolet | $47,256 | $46,345 | $45,646 | 2.0% | 3.5% |
| Chrysler | $48,472 | $46,229 | $41,408 | 4.9% | 17.1% |
| Dodge | $46,145 | $46,650 | $41,617 | -1.1% | 10.9% |
| Fiat | $29,405 | $29,247 | $30,219 | 0.5% | -2.7% |
| Ford | $51,581 | $48,965 | $44,970 | 5.3% | 14.7% |
| Genesis | $58,328 | $58,323 | $58,518 | 0.0% | -0.3% |
| GMC | $57,782 | $57,665 | $58,014 | 0.2% | -0.4% |
| Honda | $36,584 | $35,168 | $31,174 | 4.0% | 17.4% |
| Hyundai | $35,711 | $35,717 | $30,190 | 0.0% | 18.3% |
| Infiniti | $58,825 | $59,067 | $49,126 | -0.4% | 19.7% |
| Jaguar | $72,358 | $71,727 | $64,628 | 0.9% | 12.0% |
| Jeep | $52,774 | $53,367 | $44,549 | -1.1% | 18.5% |
| Kia | $34,531 | $34,945 | $31,019 | -1.2% | 11.3% |
| Land Rover | $92,072 | $92,537 | $84,079 | -0.5% | 9.5% |
| Lexus | $55,625 | $55,905 | $50,760 | -0.5% | 9.6% |
| Lincoln | $64,303 | $61,679 | $61,843 | 4.3% | 4.0% |
| Mazda | $30,767 | $31,220 | $30,917 | -1.5% | -0.5% |
| Mercedes-Benz | $76,161 | $76,340 | $65,872 | -0.2% | 15.6% |
| Mini | $40,209 | $38,320 | $34,341 | 4.9% | 17.1% |
| Mitsubishi | $30,377 | $30,019 | $25,233 | 1.2% | 20.4% |
| Nissan | $35,561 | $34,770 | $31,512 | 2.3% | 12.8% |
| Polestar | $59,450 | $59,181 | 62219 | 0.5% | -4.5% |
| Porsche | $115,825 | $115,976 | $101,708 | -0.1% | 13.9% |
| Ram | $59,969 | $60,320 | $55,291 | -0.6% | 8.5% |
| Rivian | $72,973 | $72,687 | – | 0.4% | – |
| Subaru | $33,859 | $34,660 | $33,521 | -2.3% | 1.0% |
| Tesla | $64,989 | $65,369 | $57,522 | -0.6% | 13.0% |
| Toyota | $36,852 | $37,575 | $35,528 | -1.9% | 3.7% |
| Volkswagen | $36,657 | $36,412 | $33,400 | 0.7% | 9.8% |
| Volvo | $62,075 | $62,536 | $52,140 | -0.7% | 19.1% |
| Industry | $47,148 | $46,676 | $41,534 | 1.0% | 13.5% |
| *Kelley Blue Book average transaction prices do not include applied consumer incentives |
| Segment | May 2022 Transaction Price (Avg)* | April 2022 Transaction Price (Avg)* | May 2021 Transaction Price (Avg)* | Month- Over- Month Percent Change | Year- Over- Year Percent Change |
| Compact Car | $26,101 | $26,092 | $23,462 | 0.0% | 11.2% |
| Compact SUV/Crossover | $34,702 | $34,321 | $31,674 | 1.1% | 9.6% |
| Electric Vehicle | $64,338 | $65,094 | $56,140 | -1.2% | 14.6% |
| Entry-level Luxury Car | $52,748 | $51,968 | $47,898 | 1.5% | 10.1% |
| Full-size Car | $44,801 | $44,293 | $40,764 | 1.2% | 9.9% |
| Full-size Pickup Truck | $61,798 | $60,897 | $56,249 | 1.5% | 9.9% |
| Full-size SUV/Crossover | $72,808 | $72,115 | $68,930 | 1.0% | 5.6% |
| High Performance Car | $107,784 | $115,890 | $101,552 | -7.0% | 6.1% |
| High-end Luxury Car | $117,232 | $119,562 | $105,337 | -2.0% | 11.3% |
| Hybrid/Alternative Energy Car | $35,450 | $37,766 | $30,026 | -6.1% | 18.1% |
| Luxury Car | $78,173 | $77,643 | $69,363 | 0.7% | 12.7% |
| Luxury Compact SUV/Crossover | $53,751 | $53,693 | $48,174 | 0.1% | 11.6% |
| Luxury Full-size SUV/Crossover | $99,704 | $100,983 | $96,559 | -1.3% | 3.3% |
| Luxury Mid-size SUV/Crossover | $70,007 | $69,776 | $64,941 | 0.3% | 7.8% |
| Luxury Subcompact SUV/Crossover | $44,896 | $45,793 | $42,229 | -2.0% | 6.3% |
| Mid-size Car | $31,672 | $31,978 | $29,609 | -1.0% | 7.0% |
| Mid-size SUV/Crossover | $46,859 | $46,855 | $43,109 | 0.0% | 8.7% |
| Minivan | $47,912 | $46,210 | $42,209 | 3.7% | 13.5% |
| Small/Mid-size Pickup Truck | $40,524 | $39,875 | $40,382 | 1.6% | 0.4% |
| Sports Car | $38,110 | $43,236 | $42,444 | -11.9% | -10.2% |
| Subcompact Car | $22,392 | $21,956 | $19,985 | 2.0% | 12.0% |
| Subcompact SUV/Crossover | $29,301 | $29,067 | $27,369 | 0.8% | 7.1% |
| Van | $49,302 | $49,300 | $42,804 | 0.0% | 15.2% |
| Industry | $47,148 | $46,676 | $41,534 | 1.0% | 13.5% |
| *Kelley Blue Book average transaction prices do not include applied consumer incentives |
Content created by Conservative Daily News and some content syndicated through CDN is available for re-publication without charge under the Creative Commons license. Visit our syndication page for details and requirements.


