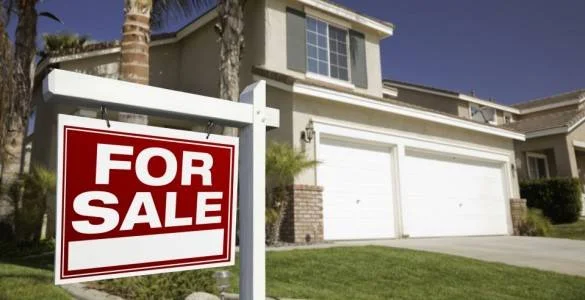
More than Six Million Homes Missing From U.S. Housing Market
One of the defining characteristics of today’s housing market is the lack of available inventory, and much of this scarcity can be traced back to the lack of building following the bubble’s burst.
Between 1985 and 2000, there were 3.9 permits issued for single-family homes per 1,000 residents. Since 2008, that mark stands at just 1.9 permits per 1,000 people. If that historic rate had continued over the past decade, there would be about 6.3 million more single-family homes in the housing stock, according to a Zillow® analysis. It would take about five years of building at the current pace of 1.3 million homes per year just to add those “missing” homes.
Inventory has been falling on an annual basis for the past 41 months, although its decline has slowed in recent months. With such limited inventory, competition for available homes has been particularly fierce in recent months in the nation’s hottest housing markets, driving up prices and making it more difficult for new buyers to enter the market. The median home value is higher than its pre-recession peak in more than half of the nation’s largest markets.
Since 2008, only Houston has kept up with its pre-bubble building pace, issuing more residential permits than there would have been at the historic rate. The permit pace in Las Vegas slowed the most, falling from 14.4 permits per 1,000 residents prior to the housing boom to just 3.2 permits for every 1,000 residents over the past 10 years.
“Building activity came to a near-standstill when the housing market collapsed, and now a decade later, years of underbuilding have left a gap of millions of homes missing from the American housing stock,” said Zillow Senior Economist Aaron Terrazas. “In nearly every major market today, single-family homes are being permitted at a lower rate than they were historically as builders face a number of challenges in adding new homes, including land and labor costs. What this means for buyers is a smaller supply of homes on the market, leading to increased competition and higher home prices. Historically, population growth has been met with new construction and new construction was a critical contributor to new inventory. Without a sustained pickup in permitting and construction activity, first-time buyers will struggle to gain a foothold on homeownership.”
Another effect of fewer homes being built is that existing homes are getting older. The median age of homes that sold in 2007 was 24 years. By 2017, that had increased to 37 years, bringing a new set of challenges around home maintenance as the structures age. In Indianapolis, the median age of a sold home increased from 21 years to 41 years, the biggest age increase among the 35 largest metros.
|
Metropolitan Area |
SFR Permits |
SFR Permits |
Median |
Median |
|
United States |
3.9 |
1.9 |
24 |
37 |
|
New York, NY |
1.5 |
0.5 |
49 |
58 |
|
Los Angeles-Long Beach-Anaheim, CA |
1.5 |
0.5 |
44 |
54 |
|
Chicago, IL |
3.1 |
0.7 |
36 |
47 |
|
Dallas-Fort Worth, TX |
5.1 |
3.4 |
10 |
22 |
|
Philadelphia, PA |
3.2 |
1.0 |
51 |
59 |
|
Houston, TX |
3.6 |
4.9 |
8 |
24 |
|
Washington, DC |
6.1 |
2.0 |
21 |
33 |
|
Miami-Fort Lauderdale, FL |
5.1 |
0.9 |
25 |
36 |
|
Atlanta, GA |
9.9 |
2.6 |
11 |
24 |
|
Boston, MA |
2.3 |
0.9 |
50 |
57 |
|
San Francisco, CA |
2.3 |
0.8 |
42 |
53 |
|
Detroit, MI |
3.2 |
1.0 |
55 |
62 |
|
Riverside, CA |
7.9 |
1.5 |
18 |
30 |
|
Phoenix, AZ |
9.2 |
2.9 |
10 |
23 |
|
Seattle, WA |
4.8 |
2.1 |
21 |
35 |
|
Minneapolis-St Paul, MN |
5.7 |
1.7 |
21 |
38 |
|
San Diego, CA |
3.6 |
0.8 |
24 |
37 |
|
St. Louis, MO |
3.8 |
1.6 |
42 |
51 |
|
Tampa, FL |
5.4 |
2.5 |
23 |
35 |
|
Baltimore, MD |
4.7 |
1.5 |
41 |
45 |
|
Denver, CO |
5.4 |
2.5 |
24 |
34 |
|
Pittsburgh, PA |
2.0 |
1.3 |
55 |
65 |
|
Portland, OR |
5.4 |
2.2 |
23 |
36 |
|
Charlotte, NC |
7.8 |
4.2 |
7 |
21 |
|
Sacramento, CA |
6.8 |
1.8 |
20 |
33 |
|
San Antonio, TX |
3.4 |
2.6 |
8 |
22 |
|
Orlando, FL |
10.1 |
3.8 |
11 |
25 |
|
Cincinnati, OH |
4.4 |
1.5 |
35 |
49 |
|
Cleveland, OH |
2.5 |
1.1 |
53 |
62 |
|
Kansas City, MO |
5.1 |
1.8 |
33 |
43 |
|
Las Vegas, NV |
14.4 |
3.2 |
7 |
18 |
|
Columbus, OH |
4.7 |
1.7 |
31 |
42 |
|
Indianapolis, IN |
5.9 |
2.5 |
21 |
41 |
|
San Jose, CA |
2.0 |
0.8 |
36 |
47 |
|
Austin, TX |
6.0 |
5.3 |
6 |
16 |
Zillow


