‘National Embarrassment’: Key Stat Used In Biden Admin’s Landmark Climate Report Is Misleading
![]()
A key top-line statistic featured in the Biden administration’s latest report on the state of climate change in the U.S. is misleading in several ways.
The Fifth National Climate Assessment (NCA 5) features numerous analyses and graphics that purport to highlight extreme weather events that result in at least $1 billion of damage, as well as using monetary losses from events like hurricanes and floods as a de facto proxy for climate change intensity. Critics of the metric assert that its use obscures key context, namely the growth of population, asset density and asset values in coastal regions that inflate the prevalence of billion-dollar damage events.
“There is no peer-reviewed science that attributes any part of increasing disaster losses to changes in climate,” Roger Pielke, Jr., a professor at the University of Colorado who has extensively studied and written about the politicization of science, told the Daily Caller News Foundation. “To see evidence of changes in climate, look at climate data, not economic data.”
Pielke, Jr. has harshly criticized the billion-dollar damages metric in the recent past, writing in January that its use by supposedly authoritative scientific bodies amounts to a “national embarrassment,” pointing out that “an identical hurricane making landfall in Florida in 1980 versus 2023 would result in vastly different loss totals, because today there are simply more people in more homes with more stuff than 43 years ago.”
Criticisms of the metric did not stop the Biden administration from relying on it in the NCA 5, specifically with regard to some of its analysis of the American Southeast. The region’s coastal states are the nation’s most prone to hurricanes, the frequency and intensity of which are frequently highlighted by climate alarmists and activists as a concrete example of the threat that climate change poses to American society.
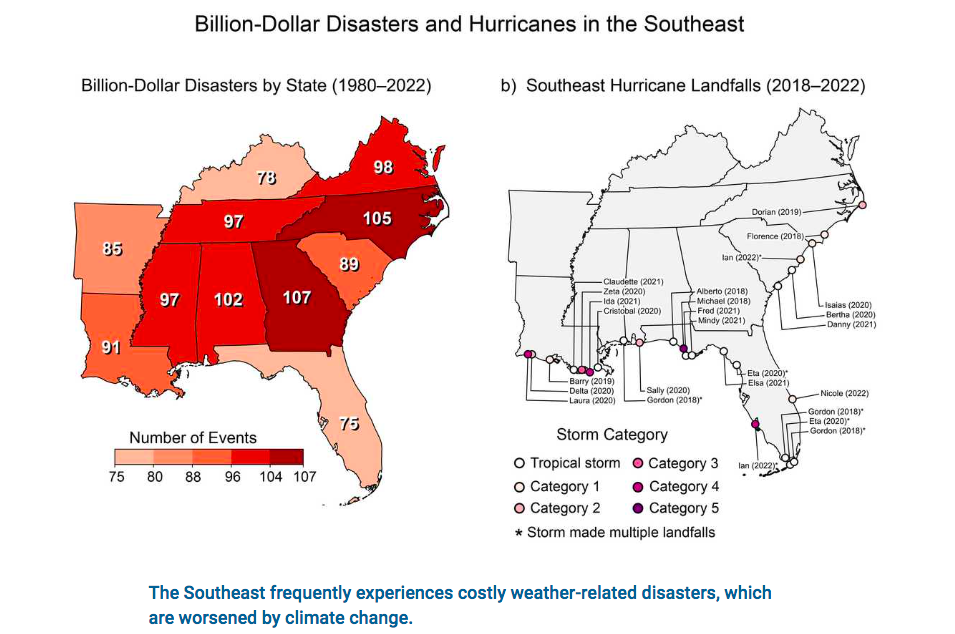
A graphic from NCA 5 showing National Oceanic and Atmospheric Administration (NOAA) billion-dollar disasters by state from 1980–2022 in the Southeast. The map adds up billion-dollar events for each state affected (i.e., it does not mean that each state shown suffered at least $1 billion in losses for each event), according to its caption in the NCA 5 report. (Screenshot / Public via NCA 5 report)
The NCA 5 graphic would lead the unscrupulous viewer to believe upon first glance that there have been more than 900 billion-dollar loss events between 1980 and 2022.
However, data published by the National Oceanic and Atmospheric Administration (NOAA) shows that the actual number for that time period is 373. The reason for the discrepancy between NOAA’s data and the NCA 5 graphic is that billion-dollar damage events typically impact more than just one state; accordingly, the NCA 5 graphic adds to the count for each state affected by the same billion-dollar damage event, regardless of whether or not each state impacted suffered a billion dollars of losses on its own in such a scenario, according to the graphic’s caption.
“The increase in population and material wealth over the last several decades are an important cause for the rising costs,” according to NOAA’s website. “These trends are further complicated by the fact that much of the growth has taken place in vulnerable areas like coasts, the wildland-urban interface and river floodplains.”
Additionally, weather events that did not meet the billion-dollar threshold when they occurred in the past are retroactively classified as such once their costs are adjusted for inflation, meaning that a $900 million dollar event in 1985 would be classified as a billion-dollar event when adjusted for today’s inflation, according to NOAA.
Pielke, Jr. ran his own analysis in his January piece, putting North American catastrophe losses in terms of U.S. gross domestic product (GDP). He found that “North American catastrophe losses as a proportion of U.S. GDP clearly show no upwards trend.”
This crucial context complicating the statistic’s validity as a de facto proxy for the intensity of climate change has not stopped the White House from using it as such anyways.
“Climate change is a major driver for the increased frequency, duration, and severity of extreme weather and climate-related disasters,” according to a 2021 fact sheet published by the White House. “Millions of Americans feel the effects of these extreme events when their roads and schools flood, and hospitals lose power. Over the past few years, the frequency of extreme weather and climate-related disaster events with losses exceeding $1 billion has skyrocketed.”
In addition to the content focusing on billion-dollar damage events, the report also touts its use of “indigenous knowledge” to arrive at its findings. The report also includes a section linking climate change to pandemics and an entire section on the intersections of climate change and social justice.
“The NCA should never have been placed under the White House. It is too tempting for both Republicans and Democrats to use it for politics,” Pielke, Jr. told the DCNF.
Neither NOAA nor the White House responded immediately to requests for comment.
Content created by The Daily Caller News Foundation is available without charge to any eligible news publisher that can provide a large audience. For licensing opportunities of our original content, please contact licensing@dailycallernewsfoundation.org