Flu Numbers Inflated for Decades, a DEEP DIVE into the Conflicts of Interests

The Centers for Disease Control (CDC) are tasked with informing the public on the number of patients dying from Coronavirus, among other aspects of infection control. Why does the CDC report the Mortality Surveillance numbers for this crisis by lumping vital statistic reports for Pneumonia, Influenza, and COVID-19 together? Is their goal to produce a larger number as COVID-19 attributed deaths, only to break out in detail buried deep in the data? Consider the following chart:
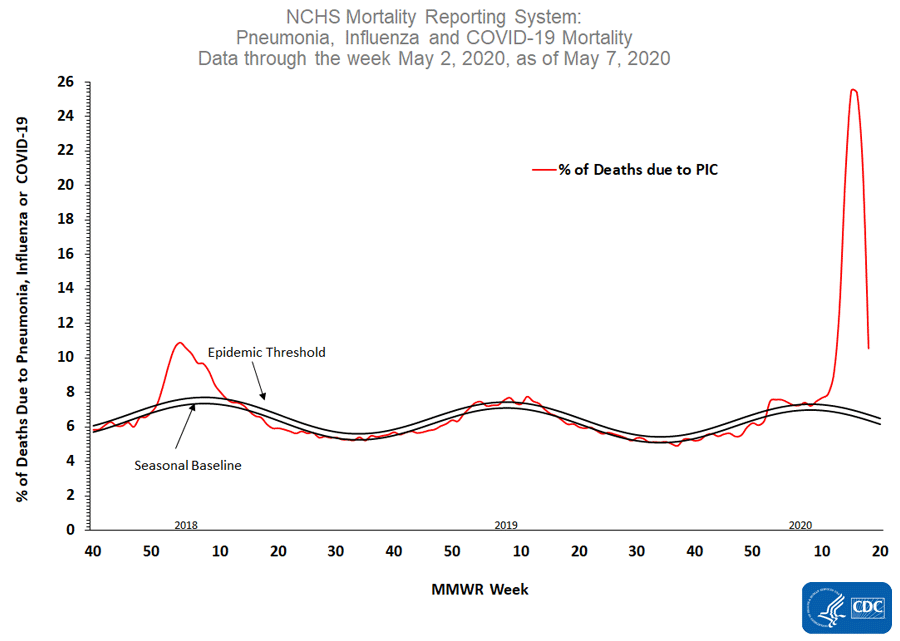
Denoted on the left side of the graph – the index states, “percent of deaths due to Pneumonia, Influenza OR COVID-19.” The media and political left have been scrambling to censor and dismiss any notion that not ALL death certificates (vital statistics) are patients who died from the pathogen COVID-19. Despite startling evidence that some, certainly not all, death certificates may not be accurate. Several physicians have raised concerns that the CDC guidelines instruct that a COVID-19 positive test (even post-mortem) is not required when completing the death certificate as COVID-19. What possible rationale would there be to provisionally assume the cause of death when one can test before or after expiring, even collecting a tissue sample for testing at a later date, to confirm the diagnosis.
Here is just a small sample of physicians who have addressed their concerns over vital statistic manipulation data entry on COVID-19 death certificates – see here, here, and here. These three reports have been taken down off YouTube, Twitter, and Facebook since going public. Recently the Pennsylvania Coroners identified deceased COVID-19 persons who, upon closer review, did not die from COVID-19. This resulted in the slashing of the numbers attributed to the pathogen. Project Veritas uncovered additional disturbing information:
Consider before Coronavirus between 20 – 30 percent of all Death Certificates nationwide were not correctly classified (audit). Where are all the normal seasonal Influenza deaths this year being counted post the COVID-19 (Jan 2020)? Flu season starts in October and runs through May each year in the United States. This 2019-2020 season had been virulently leading up to January, and suddenly, the CDC numbers dramatically plummeted. Right Wire Report did a story on this issue here. Additionally, the latest news out of Italy points to serious flaws in recording deaths accurately. Watch a fiery speech by politician explaining this latest information here. Consider the following excerpt:
“On re-evaluation by the National Institute of Health, only 12 percent of death certificates have shown a direct causality from Coronavirus, while 88 percent of patients who have died have at least one pre-morbidity – many had two or three,” says Prof Ricciardi.scientific adviser to Italy’s minister of health.
So at this juncture, we have at least established a serious review is needed on how the CDC and the John Hopkins data – and the downstream organizations have been utilizing vital statistics and keep pumping out alarming death rate numbers on a website ticker for all to see. But now let us turn to the question, why muddy the stats at the CDC in the first place, and is there any precedent for doing so?
Well, it just so happens there is!
Rather than repeat excellent analysis already assembled by Epoch Times in November of 2018, by Jeremy R, Hammond ( “How the CDC Uses Fear To Increase Demand for Flu Vaccines“) – take the time to read through the piece. The way the CDC uses modeling to estimate annual Influenza death and what constitutes a Flu death has been skewed and inaccurate for over a decade. They presently apply the same methodology reporting COVID-19 deaths and projections.
When did this bundling of flu and Pneumonia deaths start? Looking closer, the CDC began “playing up flu deaths” over a decade ago when the manufacturers of vaccines complained not to have enough orders were being placed for the product. The CDC also observed the public response to getting the flu vaccine unacceptable. The action plan by the CDC was known as the “Seven-Step Recipe,” which was presented at the 2004 National Influenza Vaccine Summit. Below is a graphic that was shown at this presentation.
The CDC outlined a “Recipe for Fostering Public Interest and High Vaccine Demand.” No, you are reading correctly, the CDC was marketing the vaccine and manipulating numbers of hospitalizations and deaths contributed to Influenza to hype fear. The media was also complicit in doing so. Glen Nowak, CDC’s acting director of media relations, was the frontman and even went on Public Radio to pimp his marketing plan, saying, “It really did look like we needed to do something to encourage people to get the flu shot.” The public had no clue that the numbers were only estimations based on faulty and manipulated modeling.
In 2004, Barbara Loe Fisher, president of the National Vaccine Information Center, (not funded by vaccine producers) stated:
“We have known for several years that the CDC is employing behaviorists and communications specialists to instill fear and anxiety in public about infectious diseases in order to promote mass vaccination. But the rhetoric about flu risks has been especially over the top,” “The public is not being well-served by federal health officials who use deceptive propaganda techniques to panic people into standing in lines to get flu vaccine rather than tell them the real truth about flu risks as well as vaccine risks.”
The flu death rates on their own did not create enough risk to support the flu vaccine’s high usage. Sound familiar? The object was to produce a high enough threshold of death and hospitalizations to warrant mass numbers of vaccines needed. The Epoch Times article above mentions Dr. Peter Doshi, who, as a Graduate student at the time, wrote, “Are US death figures more PR than science?” The article is laden with stats and worth the read, but he concludes:
“If flu is, in fact, not a major cause of death, this public relations approach is surely exaggerated. Moreover, by arbitrarily linking flu with Pneumonia, current data are statistically biased. Until corrected and until unbiased statistics are developed, the chances for sound discussion and public health policy are limited.”
Later while doing his postdoctoral work, Doshi wrote, “Influenza: Marketing Vaccine by Marketing Disease:”
“…across the country, mandatory Influenza vaccination policies have cropped up, particularly in healthcare facilities, precisely because not everyone wants the vaccination, and compulsion appears the only way to achieve high vaccination rates. Closer examination of Influenza vaccine policies shows that although proponents employ the rhetoric of science, the studies underlying the policy are often of low quality, and do not substantiate officials’ claims. The vaccine might be less beneficial and less safe than has been claimed, and the threat of Influenza appears overstated.”
The health care industry alone purchase large volumes of vaccines for employees annually, universities, and Corporate well programs do the same. It was just a few years ago that our local Walgreens started giving the shot in the store, and other chains followed suit. The marketing campaign was working and creating a multi-billion dollar business model. For more stats, read Dr.Tom Jefferson’s take on the matter.
The articles are deep in the weeds at times, but what emerged is a clear picture that explains much of the glaring red flags many of us pick up on presently with how the numbers and policy objectives during this COVID-19 crisis make no sense. Here are some key points to drill down on:
1. Most pneumonia deaths are unrelated to Influenza.
The American Lung Association has more than 30 different causes of Pneumonia, Influenza being but one of them. For example, “stomach acid-suppressing drugs are associated with a higher risk of community-acquired pneumonia, but such drugs and pneumonia are not compiled as a single statistic,” explained Dr. David Rosenthal, director of Harvard University Health Services. “People don’t necessarily die, per se, of the [flu] virus – the viraemia. What they die of is secondary Pneumonia.” Elderly patients with late-stage Alzheimer’s, usually in nursing home settings, have great difficulty swallowing and aspirate, often leading to Pneumonia.
The CDC itself acknowledges the slim relationship, saying “only a small proportion of deaths … only 8.5 percent of all pneumonia and Influenza deaths [are] Influenza related.” If the CDC has been bundling Pneumonia deaths in with Influenza data for a decade and now is doing the same with COVID-19, there can be no credible determination of primary vs. secondary cause of death. A significant percentage of Influenza deaths before COVID -19 was Pneumonia unrelated to viraemia and many bacterial. The CDC even created the sound-alike term, “Influenza-associated death.” Why can we not assume the same pattern is happening in present reporting?
2. CDC enlists computer models to arrive at its flu-death estimate annually.
September 2018, the CDC claimed 80,000 people died from the flu during the 2017 – 2018 flu season.
“What is not being communicated to the public is that the CDC’s numbers do not represent known cases of Influenza. They do not come directly from surveillance data, but are rather controversial estimates based on controversial mathematical models that may greatly overestimate the numbers.”
When pressed on that number compared to actual death certificates denoting Influenza as the cause of death, the CDC fell back on a sliding scale estimate of anywhere from 3,000 and 49,000 yearly deaths on average and as many as up to 80,000 on above-average estimates. For the last decade, the CDC was never claiming a precise number of persons dying from Influenza only a presumed estimate based on models they create, and only they enter data points.
Presently, with COVID-19, there is a body attached to each number. The CDC reports the variance here is the bundling of three possible reasons, being Influenza, Pneumonia, or COVID-19. The truth is the media only speak of that number as emphatic COVID-19 causation. The CDC just put out their 2019 – 2020 Influenza deaths, and the estimate spread was as low as 24 k and as high as 62 k. Wow, talk about wiggle room!
Dr. Birx admitted to the very liberal counting of COVID-19 deaths.
The Washington Post reported on May 10th that Dr. Birx, in a heated exchange behind closed doors, that she could not trust any of the numbers coming out of the CDC. Reportedly she questioned the antiquated systems the CDC uses to track deaths and infections and felt they could be inflated as much as 25%.
3. Flu vaccines often fail and do not work against all strains of Influenza.
Vaccines run about 30-40% efficacy and some years less than that. They are formulated annually based on what the CDC advises. For decades, tests suggested the flu vaccine worked extremely well, but in the past 15 years, a better test revealed many infections in vaccinated people who would previously have been deemed protected. See the following chart and video to explain further:

Now consider over more than 50% of COVID-19 recorded deaths are from Nursing Homes, and a large percentage of minorities (high % Medicaid) with comorbidity are also largely represented in the death counts.
5. Now the focus is on numbers to justify massive efforts to find a vaccine to give to the world.
There are many key players in both the decades-long flu vaccine push/hype and the present day COVID-19 crisis, who now overlap. Their names are commonly written about on a daily basis and reflect the immense conflict of interests each appears to have. One of the most visible is Bill Gates. Recently he was interviewed and stated:
“My Foundation is focusing all efforts on discovering a vaccine and until we find a vaccine life cannot and will not return to normal.” Gates used to be the second larger funder of the World Health Organization, but since the USA has held all funding, he is now number one.
We do not claim to be medical or scientific experts. But if one takes the time to review the data contained in the links and analysis from the experts therein, we stand behind the obvious conclusion. The CDC, NIH, and most research facilities/universities have become too politicized and personally monetized to be entirely effective in protecting the public from infectious diseases.
The incentives to play loose and mold outcomes with data-driven models used to establish policies and protocols has weakened the credibility of the institutions. And finally, there should be zero need to bundle diseases when reporting on the cause of death or not testing (vital statistics), and absolutely no rationale for deploying such tactics and social media platform censoring information or labeling voices as conspiracy theories if the true goal is to deliver the best practices and standard of care.
If it is what it appears to be, there are directed measures in play to produce the largest number of deaths assigned as COVID-19. Taking advantage of the in-progress Influenza season, the normal rate of pneumonia-related deaths in the elderly, and steady rates of comorbidity related deaths in minorities to pad the body count would be unconscionable. However, it would be rather easy to accomplish in the fog of media-driven hysteria and past conduct and practices with Influenza stats.